Search Blog Posts

Showing posts with label Stock Market. Show all posts

Saturday, December 13, 2014

Central Banking Dysfunction in an Era of Stock Market Volatility


Anthony Wile
A recent article in The Market Oracle caught my eye: "Largest Financial Bubble in History – 10 years of 'Why Sell Now?' "
The article was written this past week during a powerfully slumping market that trimmed hundreds of points off the Dow Jones industrial average. It was written by registered investment advisor Doug Wakefield.

Is this the end of the bull market? I'm not going to forecast short-term ups and downs but the article did remind me once again of the larger dysfunctional nature of our modern financial system.

That's what I want to concentrate on today, for the most part anyway. What I enjoyed the most about the article was its blunt discussion of issues that have received widespread coverage here and that occupy people considerably when it comes to markets and investments.

Most people following these issues would agree that stocks have been propelled forward by a variety of methods including significant asset inflation and regulatory changes that make investing easier. But when will these maneuverings lose their impact? This is no hypothetical question, as we've been reminded once again.

A recent article posted at CNBC entitled "Stocks slide with oil; triple-digit losses for Dow" summarized some of the damage that took place this past week.

U.S. stocks declined on Friday, with benchmark indexes headed for sizable weekly losses, as crude's ongoing slide rattled investors.

"This started a week or so ago, we'd recovered from the October low to a level that is arguably overvalued, and when we're overvalued everything has to go right, and what's not going right is what's happening to the price of oil, and what that means for Russia, Europe and the U.S.," said Hugh Johnson, chairman of Hugh Johnson Advisors.

"Everybody likes to say the price decline in oil is good news for the U.S. economy, but the real issue is this is really bad news for Russia, and by implication, bad news for Europe, which does a lot of business with Russia," said Johnson.

The article makes the point that it is the slumping price of oil that is driving negative stock market action. The concern weighing on the market involves a slowdown in Europe as a result of lower oil prices. The more optimistic story involves a continued "recovery" in the US based on the same price erosion.

Of course, these price movements do not exist in a vacuum. It may be that Western oil prices have slumped at least for the moment based on powerful interests determined to make it more difficult for Vladimir Putin and Russia to recover from various Western embargos.

Why does the West currently seek low oil prices, if it does? Well, one reason is because Putin is said to be buying gold with US dollars and by trimming the price of oil, Western powers are reducing a main source of revenue.

This is just one example of how markets and commodity prices may be subject to larger socioeconomic, political and military considerations. And one can make the argument that major stock markets are extremely vulnerable to such manipulations.

But the biggest manipulation of all is central banking. Central banks – and there are now some 150 of them – are said to have printed something like US$ 50 trillion in the past years since the 2008 financial crisis.

This unimaginable torrent of money has inflated markets around the world and especially in the US. Wakefield's article is persuasive because he reminds us of the probable outcome of this kind of massive monetary inflation.

He writes: "While finding the end of the largest financial bubble in history has proved very illusive over the last three years for some of the most seasoned market technicians in the world, the last fifteen have allowed us to have many reminders that wild rides to the top have always ended the same."

And he cites the following facts to impress upon us the rapidity with which markets can move: "In January of 2006, investors opened an average of 2,708 brokerage accounts per day. By August of 2007, the average had grown to 450,000 individuals accounts opened per day."
... As we head for the close of 2014, and looking at current and former rapidly rising price movements, would one really be all that surprised to find 2015 radically different from the last few years? Considering how much debt has been created merely to stall this "all time high" bubble, would we not expect the downside of financial assets globally to be extremely severe?

He also cites a Bloomberg article entitled "Global Debt Exceeds $100 Trillion as Governments Binge, BIS Says ..."

The amount of debt globally has soared ... to $100 trillion since the first signs of the financial crisis as governments borrowed to pull their economies out of recession and companies took advantage of record low interest rates, according to the Bank of International Settlements.

... Borrowing has soared as central banks suppress benchmark interest rates to spur growth after the U.S. subprime mortgage market collapsed and Lehman Brothers Holdings Inc.'s bankruptcy sent the world into its worst financial crisis since the Great Depression.....

... One thing is for certain. The memory of the 83% decline in the NASDAQ between 2000 and 2002 has long since been forgotten in a world of "money for nothing".

Well ... it hasn't been forgotten this week! And we've always kept it well in mind. We're quite aware of inflation-based market volatility. We've pointed out how orchestrated this stock market run-up has been and how averages are manipulated by central banks themselves that have admitted to interfering directly in the stock market.

That said, we've also predicted that the current "Wall Street Party" might end imminently – or might NOT. We're past the peak volatility months of October and November and markets – absent yesterday's horrendous price action and anomalous oil deflation – usually tend to stabilize late in the year.

Of course, Black Swan events can likely trigger a market meltdown at any point. Let's see what next week brings. Maybe more volatility or a considerable slump? Despite volatility, Western marts may be positioned for continued progress, lubricated of course by tremendous amounts of additional money printing.

We no longer live in a time when we can calculate market forces to aid in our predictions. Instead, we must turn to strategies such as our VESTS model that seek to evaluate what powerful market participants intend to accomplish in an Internet era that makes such manipulations more difficult via increased transparency.
A sad new era. Like you, I accommodate myself to it. Reality is what it is. But the control that central bankers and their colleagues have over markets, monetary policy and more, is in the long run a-historical and intolerable.

The damages are already clear to some, but for most, once this market breaks, a vivid new reality will come into focus... one that will include massive discontent and, to be gentle about it... widespread civil unrest. You won't need a zoom lens to see it.

The larger point to keep in mind? This is an extremely unstable and culturally corrosive system. There is absolutely no justification for concentrating so much monetary power in so few hands. It cannot stand.

And it will not. At High Alert we suggest that protecting one's assets and family mobility are essential at this time... prudent at all times, but even more so now.

Merry Christmas! We are pleased to announce that High Alert Investment Management will be launching a new, more robust Daily Bell website on December 24th. You can expect High Alert to introduce you to ideas and solutions that can help you protect your assets, grow your wealth or enhance and ensure your lifestyle.
Source TheDailyBell

Tuesday, November 11, 2014

Silver to S&P Ratio: What It Tells Us : The Market Oracle

Nov 11, 2014 - 02:58 PM GMT
By: DeviantInvestor
 
Take the price of silver, multiply by 100, divide by the S&P 500 Index and chart it for 30 plus years.  What do we see?


Now look at the 13 years since 9-11 when the gold, silver and commodities bull markets began.

Silver to S&P Ratio (Si/SP) is currently at an 8 plus year low.

Si/SP is below its upward linear trend shown in red since 9-11.

Over the long term the ratio shows the desirability of hard assets such as silver versus the desirability of paper assets such as the S&P.

The ratio declined from 1980 to about 2001, increased to 2011, and crashed since then.

QE started in late 2008 and stimulated the S&P off it March 2009 lows. 

Most of the $Trillions in newly created Fed dollars went into the stock and bond markets, and not into the silver and gold markets.

Subsequent to 2011, the S&P has charged upward while silver has crashed to about 30% of its April 2011 high.

Now examine the difference between the ratio and the linear trend shown above in red.

COMPARISONS:

Item                                           S&P                                     Silver
3 – 5 year history              Triple since lows                     Down by 70%
Recent activity                  All-time highs                         70% below all-time highs
The Fed & QE                  QE levitates the S&P              QE – not much help
Chinese purchases           Probably not                          Huge purchases
Warfare increasing            Likely to hurt S&P                   Likely to help silver
Middle-East trauma           Likely to hurt S&P                   Likely to help silver
Political turmoil                  Likely to hurt S&P                   Likely to help silver

We could go on, but it is clear to me that the S&P is near all-time highs and is at risk from declining QE, excessive valuation, increasing wartime threats, Middle-East trauma, and US political turmoil.  Silver is near a 5 year low, 70% off its highs, and likely to rise based on the same issues that could hurt the S&P.

The Si/SP ratio shows that silver is deeply oversold and far below its typical levels.  The ratio is at an 8 year low, even below the 2008 silver crash lows, and not far above 30 plus year lows.

Based on Friday’s upticks, last week may have been the turning point for silver prices and the silver to S&P ratio.  Or perhaps the S&P will continue reaching for the sky even though QE is supposedly diminishing, while silver prices drop further below the cost of production.  Both seem unlikely but we shall see.

What is clear is that silver and gold are currently selling at bargain prices and the S&P is selling at very high prices.  If the silver market has finally found a bottom then silver is – right now – an excellent investment, financial insurance, and protection for your purchasing power and savings.

For those who bought silver (and gold) at higher prices, the long-term trend is up and will eventually express itself.  Waiting for the turnaround is painful, but now is a lousy time to lose sight of the “big picture” and sell at a loss.  Instead, now is a far better time to buy.

If you bought silver at lower prices, you probably feel good knowing that your investment is currently profitable even at these post-crash levels.  Further, silver prices are highly likely to increase substantially in the next few years.

KISS!  Keep Increasing Silver Stack!  Keep It Simple – Silver!
via marketoracle

Sunday, October 5, 2014

Gold To Go Parabolic - Global Bond Market “Cliff” and "Armageddon" Cometh


The current U.S. bond market faces a "liquidity cliff" and looks like an asset "bubble" that could burst when interest rates start to rise, according to the senior U.S. securities regulator. This is something we have been warning of in recent months.

The consequences of the bursting of the bond bubble would be rising interest rates which would likely impact property and stock markets and benefit
safe haven gold.


Exter's Golden Pyramid

Securities and Exchange Commission (SEC) Republican member Daniel Gallagher said over a year ago that the $3.7 trillion municipal bond market may suffer"Armageddon" once interest rates climb.

The Fed has continued ultra loose monetary policies and debt monetisation for more than six years now. It has kept its benchmark interest rate near zero since December 2008. The Fed already employed three quantitative easing rounds buying up bonds to help stimulate the U.S. economy after the financial crisis.
The Fed maintains that the program will end this month and many investors expect the Fed to move to a tighter monetary policy. However, we believe that if the Fed increases rates, it would likely lead to a sharp recession and possibly a Depression. It would also likely lead to serious volatility in markets and the risk of a triple stock, bond and property crash.
There has been jitters in bond markets in recent days. PIMCO saw $448 million in fund outflows last Friday. Bill Gross's departure from PIMCO to join Janus Capital Group is being blamed for some of the jitters but it may be that investors internationally are concerned about over valuation in bond markets and heading for the exits - before the stampede begins.

Given concerns about the crisis on global bond markets and indeed the wider financial system, it is worth remembering one of the greatest central bankers of the modern era, John Exter and his insightful 'golden pyramid' (see above and below).


John Exter is known for creating Exter's Pyramid, also known as Exter's Golden Pyramid and Exter's Inverted Pyramid.

John Exter (September 17, 1910 – February 28, 2006) was a highly respected American economist, member of the Board of Governors of the United States Federal Reserve System, and founder of the Central Bank of Sri Lanka.

His golden pyramid allowed for the visualisation and the organisation of assets and asset classes in terms of risk and size. Exter rightly believed that gold is the safest asset and therefore gold forms the small base as the most reliable value and the asset classes on progressively higher levels are more risky.

The larger size of asset classes at higher levels is representative of the higher total worldwide notional value of those assets. While Exter's original pyramid placed Third World debt at the top, today derivatives hold this dubious honor.

Exter was highly respected for his great intellect and he also had all the mainstream credentials. He was Harvard educated, a Federal Reserve economist, a member of the Council of Foreign Relations and quite unusually among mainstream insiders, Exter believed in gold as money and a store of value.

He was a friend of the great Austrian economist, Ludwig von Mises. and debated the inflation versus deflation argument all the time with von Mises.

Given the huge levels of government debt throughout the developing and developed world, global bond markets today are multiple times bigger than they were in the 1970s when Exter created his pyramid.

In the event of another global financial crisis which we see as quite likely, capital will again flow from the riskier assets at the higher levels of the pyramid into the base of safe haven gold. While bonds were the beneficiary of the last financial crisis, they may be the nexus of the next financial crisis.

The stock of assets in the world today is multiple times bigger than it was in the 1970s and thus, gold appears very undervalued. Should we see capital flight from U.S. and global bond markets, gold should see gains on a par with those seen in the second half of  bull market in the 1970s.


Many said that gold's bubble had burst when it fell from $200 to $100 per ounce from December 1974 to August 1976.

"Experts" warned that gold would fall as interest rates rose. The opposite happened and as interest rates rose, gold rose more than 8 times in 3 years and 4 months, to $850 in January 1980.

History does not repeat, but it frequently rhymes ...

View article...

Sunday, September 21, 2014

VIDEO: Why the US is Deeply Insolvent & Only One Unfriendly Door Out

VIDEO: Why the US is deeply insolvent


Building on the previous chapter on the US’ tremendous and exponentially-increasing debt, this chapter looks at the shocking shortfall between our nation’s assets and its liabilities.
 
In short, America is deeply insolvent. We’re just not admitting it yet.
 
Perhaps not surprisingly, official statistics leave out our unfunded liabilities when calculating the net worth of the nation. Once these liabilities are added back in, America’s net worth plunges into the negative tens to hundreds of $trillions.
 
In the last chapter we noted how our vast debts place an unfair and immoral burden on future generations, and realistically can and will never be pad off. Factoring in the unfunded liabilities just makes the situation beyond absurd.


For the best viewing experience, watch the above video in hi-definition (HD) and in expanded screen mode
 
Coming next Friday: Chapter 15: Demographics
 
For those who simply don’t want to wait until the end of the year to view the entire new series, you can indulge your binge-watching craving by enrolling to PeakProsperity.com. 

The entire full new series, all 27 chapters of it, is available — now– to our enrolled users.
 
The full suite of chapters in this new Crash Course series can be found at www.peakprosperity.com/crashcourse
And for those who have yet to view it, be sure to watch the ‘Accelerated’ Crash Course — the under-1-hour condensation of the new 4.5-hour series. It’s a great vehicle for introducing new eyes to this material.

Sunday, September 14, 2014

Wall Street Is Coming to Fleece Your Town

States must follow North Dakota's lead now, or die to become an impoverished hulk of rubble.

September 14, 2014    Source: Ellen Brown, Web of Debt blog

The Fed's bizarre new rules transfer power from the public sector, once again.
In an inscrutable move that has alarmed state treasurers, the Federal Reserve, along with the Federal Deposit Insurance Corporation and the Office of the Comptroller of the Currency, just changed the liquidity requirements for the nation’s largest banks. Municipal bonds, long considered safe liquid investments, have been eliminated from the list of high-quality liquid collateral. assets (HQLA). That means banks that are the largest holders of munis are liable to start dumping them in favor of the Treasuries and corporate bonds that do satisfy the requirement.

Muni bonds fund the nation’s critical infrastructure, and they are subject to the whims of the market: as demand goes down, interest rates must be raised to attract buyers. State and local governments could find themselves in the position of cash-strapped Eurozone states, subject to crippling interest rates. The starkest example is Greece, where rates went as high as 30% when investors feared the government’s insolvency. Sky-high interest rates, in turn, are the fast track to insolvency. Greece wound up stripped of its assets, which were privatized at fire sale prices in a futile attempt to keep up with the bills.

The first major hit to US municipal bonds occurred with the downgrade of two major monoline insurers in January 2008. The fault was with the insurers, but the taxpayers footed the bill.  The downgrade signaled a simultaneous downgrade of bonds from over 100,000 municipalities and institutions, totaling more than $500 billion. The Fed’s latest rule change could be the final nail in the municipal bond coffin, another misguided move by regulators that not only does not hit its mark but results in serious collateral damage to local governments – maybe serious enough to finally propel them into bankruptcy.

Why this unprecedented move by US regulators? It is not because municipal bonds are too risky, since corporate bonds with lower credit ratings are accepted under the new rules. Nor is it that the stricter standard is required by the Basel Committee on Banking Supervision (BCBS), the BIS-based global regulator agreed to by the G20 leaders in 2009. The Basel III Accords set by the BCBS are actually more lenient than the US rules and do not include these HQLA requirements. So what’s going on?

From the Inscrutable, Unaccountable Fed

The rule change was detailed by Pam Martens and Russ Martens in a September 4th article titled “The Fed Just Imposed Financial Austerity on the States.” They write that on September 3rd:

The Federal regulators adopted a new rule that requires the country’s largest banks – those with $250 billion or more in total assets – to hold an increased level of newly defined “high quality liquid assets” (HQLA) in order to meet a potential run on the bank during a credit crisis. In addition to U.S. Treasury securities and other instruments backed by the full faith and credit of the U.S. government (agency debt), the regulators have included some dubious instruments while shunning others with a higher safety profile.

Bizarrely, the Fed and its regulatory siblings included investment grade corporate bonds, the majority of which do not trade on an exchange, and more stunningly, stocks in the Russell 1000, as meeting the definition of high quality liquid assets, while excluding all municipal bonds – even general obligation municipal bonds from states with a far higher credit standing and safety profile than BBB-rated corporate bonds.

This, rightfully, has state treasurers in an uproar. The five largest Wall Street banks control the majority of deposits in the country. By disqualifying municipal bonds from the category of liquid assets, the biggest banks are likely to trim back their holdings in munis which could raise the cost or limit the ability for states, counties, cities and school districts to issue muni bonds to build schools, roads, bridges and other infrastructure needs. This is a particularly strange position for a Fed that is worried about subpar economic growth.
Not Sufficiently Liquid?
Continue reading

Thursday, August 28, 2014

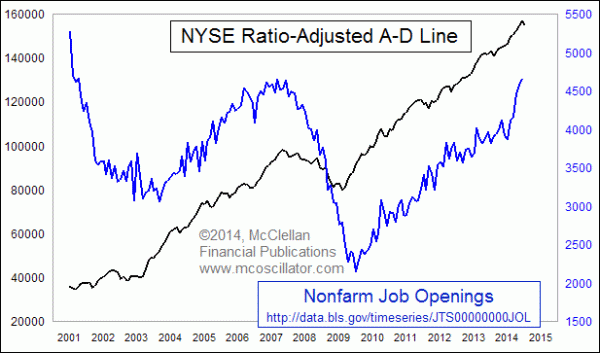
Stock Advance-Decline Line Foretells Job Openings -Technical Analysis Chart

We don't often publish specific stock market indicators. This one, however, may be a useful complement to meld with other tarot cards you may use for your investing/trading.

A-D Line Foretells Job Openings


Chart In Focus
August 28, 2014


Back in 2011, I wrote about Why Even Fundamental Analysts Should Watch A-D Line, noting that the NYSE A-D Line is very strongly correlated to corporate profits.  

But because the A-D Line can be calculated each day in real time, whereas corporate profits are reported with a significant lag, in effect the A-D Line gives a leading indication for what the profits data will look like once they are released.

The same point applies in this week's chart, which compares the NYSE A-D Line to the Bureau of Labor Statistics' measure of U.S. nonfarm job openings.  The job openings data are published monthly, and the A-D data is the month-end closing values for our Ratio-Adjusted A-D Line, which factors out the changing numbers of issues traded each day. 

Once again the correlation is really strong, but because the job openings data is reported with a lag, we actually get a leading indication.  This data series only goes back to December 2000, which is not as far back as the corporate profits data, but still that is enough time to demonstrate the correlation. 

And at the upturns from recessionary bottoms, there seems to be an actual leading indication.  The A-D Line started upward from its October 2002 low well ahead of the September 2003 bottom for job openings.  We saw the same effect in 2009.  On a month-end basis, the A-D Line bottomed in February 2009, while the job openings data finally reached its bottom in July 2009. 

One might reasonably complain that the recovery in the job openings data has not been as steep as it should have been, or as we needed it to be, and that argument has some merit.  But the A-D Line has correctly identified the direction of that movement.  And the continuing strength in the A-D statistics portends good things for a continuing jobs recovery.  At the point when the A-D Line tops and starts to turn down, it won't just be investors that will need to start worrying. 
 
Tom McClellan
Editor, The McClellan Market Report

Tuesday, August 26, 2014

Investor Net Worth Drops To New All Time Low, NYSE Reveals

Submitted by Tyler Durden on 08/26/2014 15:25 -0400

​O​ne can debate whether or not margin debt as reported by the NYSE has any relevance in a world in which the retail investor is long gone, and where the marginal buyer are hedge funds (and primary dealers who use excess reserves as collateral for marginable derivatives and futures) who fund themselves using far more arcane "shadow" repo conduits as we have explained previously, it is indisputable that the leverage statistics disclosed monthly by New York Stock Exchange provide a useful glimpse into how the broader market is obtaining "dry powder" to keep BTFATH.


And while in July margin debt did dip modestly from near all time highs hit back in June when total margin debt was virtually tied with the previous record, at $464 billion, it was that other metric tracked by the NYSE, namely Investor Net Worth, calculated by subtracting margin debt from the notional represented in free credit cash accounts and credit balances in margin accounts, that was the notable highlight in the July report: at a negative $182.1 billion, a decline of $6.3 billion from the prior month, investor Net Worth has never been lower.

This happens to be a deficit which is more than twice as large as the net worth shortfall reached during the last market bubble, which hit ($79) billion, peaking during the quant freakout in the summer of 2007 and subsequently surging to a record high of $184.6 billion in August 2008, as repo desks closed all margin positions with virtually any and every counterparty, leaving everyone in a position of record high "net worth."


Does this, or anything else, matter in a market that is exclusively centrally-planned by the central banks and various HFT algos? We urge you to direct your questions, rhetorical as they may be, on this topic to either the NY Fed or its oftentime execution trading arm, Citadel.
Source: NYSE
​Via Zero Hedge ​

New Jersey Funneling Pension Fund Cash to Wall Street Investment Managers

Are others finding it just as bewildering as we do how the politicians can keep on stealing when we've learned so much with the internet? They are an in-your-face gang, for sure. Will 'enough' ever be really enough?

We have become totally per-occupied and distracted by the street police focus that we no longer recognize law enforcement where there isn't any.


Posted on August 26, 2014 by
By David Dayen, a lapsed blogger, now a freelance writer based in Los Angeles, CA. Follow him on Twitter @ddayen

David Sirota has carved out a much-needed niche lately by poking around in the unseemly deals between public pension funds and Wall Street predators, and he brings yet another scoop, this time in New Jersey:

Gov. Chris Christie's administration openly acknowledged that more New Jersey taxpayer dollars were going to land in the coffers of major financial institutions. It was 2010, and Christie had just installed a longtime private equity executive, Robert Grady, to manage the state's pension money. Grady promoted a plan to put more of those funds into riskier investments managed by Wall Street firms. Though this would entail higher fees, Grady said the strategy would "maximize returns while appropriately managing risk."

Four years later, New Jersey has secured only half the promised results. The state has sent more pension money to big-name Wall Street firms like Blackstone, Third Point, Omega Advisors, Elliott Associates and Grady's old firm, The Carlyle Group. Additionally, the amount of fees the state pays financial managers has more than tripled since Christie assumed office. New Jersey is now one of America's largest investors in hedge funds.

The "maximized returns" have yet to materialize… Had New Jersey's pension system simply matched the median rate of return, the state would have reaped roughly $3.8 billion more than it did between fiscal years 2011 and 2014, says pension consultant Chris Tobe.

The $939.8 million million in Wall Street fees from 2010-2013 are bad enough, especially for below-market returns, but the sheer riskiness of these bets, essentially letting fund managers gamble with public money, is truly nauseating. As Sirota points out, New Jersey has authorized over one-third of its pension funds to alternative investments, from hedge funds to private equity firms to venture capital funds. That is alarmingly high. Calpers, the largest pension fund in the country, has dropped their alternative investment stake to less than half that. These investments don't outperform the market, but they're great to grease the palms of the managers with fees. In this case, those managers happen to be ket backers of Chris Christie:

The above-average costs for New Jersey are a direct result of Christie administration officials moving more pension money to Wall Street firms. The management fees those firms charge are far more expensive than the fees for passive index funds and the costs associated with equities being managed by in-house pension staff. Investments with Wall Street managers comprise less than half of New Jersey's pension portfolio — but those investments' attendant fees account for 96 percent of the pension system's total overhead expenses, according to State Investment Council documents [...]

As previously reported by IBTimes, campaign finance records show that employees and others affiliated with firms managing New Jersey pension money made $167,000 worth of donations to New Jersey Republicans since 2009. Employees of those firms have also donated more than $11 million to the Republican Governors Association and the Republican National Committee.

Christie is the chairman of the RGA and both organizations spent heavily to support his 2013 reelection campaign.

This amounts to Christie funding his presidential ambitions with New Jerseyite's taxpayer money. He funnels that money to Wall Street managers, and they recycle a chunk of it back to him and his causes. As Sirota points out, the donations line up with when the firms got the contracts to manage the pension money. In one case, a contract went to the venture capital firm General Catalyst Group right after one of their partners made a $10,000 donation to the state Republican Party.

It's more than amusing seeing Orin Kramer try to justify these practices to Sirota. Kramer, the hedgie and former chair of the State Investment Council, ran the pension fund into the ground by dumping money into Lehman-related assets, leading to $115 million in losses. (We got a very fun phone call from Kramer the last time we had the temerity to mention that on this site, so keep your line open, Yves!)

The amount of back-patting and favor-making in New Jersey, done with public money, which all then justifies cutting the meager pensions of state employees, deserves a ton more scrutiny. So it's good that Sirota's been on the case.

Source nakedcapitalism

Friday, July 11, 2014

Silver price rockets 14% in the past month and going much higher

Posted on 11 July 2014 

Gold still steals all the headlines about precious metals but really in the past month silver has been the real shooting star, up 14 per cent, albeit from a grossly oversold price level.

Nonagenarian newsletter author Richard Russell said silver would take off if it past $19.25 as we duly reported on ArabianMoney (click here) and he proved spectacularly right. So did Clive Maund (click here). Other chartists have since jumped on this bandwagon.

Bottom picking

Calling a bottom is one thing, however. Getting the speed of the recovery right is quite another. Silver's rise is dependent on many factors that have nothing to do with this useful industrial metal that is also gold's only twin as a monetary metal.

That really brings us back to gold again. For pretty much exactly the same factors that are pushing gold higher will engage silver, and then some as silver prices are leveraged to gold.

Why? It's worth repeating for the millionth time that the available silver supply is far smaller than gold so as the precious metal with the lowest capacity to meet a supply shortage the price rises the fastest.

So what of gold? After a couple of years in the doldrums global investors are looking for safe havens again this summer. Whether it's the geopolitical madness of the Ukraine, Iraq or Gaza the world looks a less certain place.

The worries over a default by Portugal's largest bank also highlight mounting concerns about the global economy and the security of what is a very shaky recovery scenario. We are not sure it is actually happening outside of asset price inflation by central banks as suggested today by our article today about the US probably being in a recession in the first half (click here).

What next?

The economic recovery, such as it was from the horrors of the global financial crisis, may well already be over and we don't like the sound of what comes next. The massive bubbles in bond, stock and real estate markets could pop suddenly resulting in a huge destruction of wealth.

How do you preserve your wealth against this? Cash and cash equivalents like precious metals are the logical safe haven moves, and when the central banks print even more money then you will only want to hold the one that they cannot print.

Silver and gold have bounced off the bottom but are going much higher, very much higher.

Friday, July 4, 2014

Bitcoin vs The Dow Jones -- New Highs


Which is more impressive?  The Dow Jones Industrial Average(DJIA) has reached new highs.  A wowing 17,000.  That's phenom levels.  So how does the stock market go to stratospheric heights when less people than ever are employed, less have money to purchase items from those companies making up this stock market index, and less are actually working to manufacturer those items.  Hence why we hear of stock market manipulation.

Whereas, Bitcoin is making steady progress price wise while simultaneously developing as both a currency and an investment.  I'm more impressed with Bitcoin, and many others are also.  Bitcoin is growing as a reliable currency as we see and hear of more vendors accepting Bitcoin and more ATM's deployed for easier access.

Bitcoin – more secure – growing – it is reaching new highs everyday as the ecosystem grows.

Thursday, June 26, 2014

The Happy Story of Boomers Retiring on Their Generational Wealth Is Wrong

Wednesday, June 25, 2014
Charles Hugh Smith
This happy story is wrong on multiple counts.

The conventional view of the Baby Boomers' retirement is a happy story:
 since we're living longer and remaining productive longer, Boomers will not be as much of a burden on Gen-X and Gen-Y as doom-and-gloomers assume.

Not only are Boomers staying productive longer, they will draw upon their vast generational wealth as they age, limiting the financial burden on younger generations.


This happy story is nicely summarized in this lengthy piece The Fear Factor: Long-held predictions of economic chaos as baby boomers grow old are based on formulas that are just plain wrong.


In this view, the only thing needed to prop up Social Security for the rest of the 21st century is a higher tax on high-income earners, in effect moving the limit on earned income exposed to Social Security taxes from about $114,000 to $217,000.


This happy story is wrong on multiple counts. Let's start with the most egregious errors:


1. It ignores the End of Work and the decline of full-time jobs


2. It ignores the Elephants in the Room, Medicare and Medicaid


3. It ignores the inconvenient reality that there is nobody to buy the Boomers' overpriced stocks, bonds and homes when they start to unload them


Put another way:
 the happy story ignores the changing nature of work and jobs, the unsustainable cost trajectory of Sickcare (a.k.a. healthcare) and the inability of Gen-X and Gen-Y to buy Boomer assets at bubble valuations. Take these factors into minimal consideration and the claim that 76 million people (out of 316 million) can retire with no negative repercussions falls completely apart.

1. The end of work and changing nature of jobs: I have covered this for many years, most recently in a program with Gordon Long: The New Nature of Work: Jobs, Occupations & Careers (25 minutes, YouTube).


Insert end of work in the custom search box on this site and you'll get 10 pages of articles published here on that topic. For example:


Global Reality: Surplus of Labor, Scarcity of Paid Work (May 7, 2012)


The reality is sobering: 57 million people draw Social Security benefits, tens of millions more draw Medicaid, Section 8 housing credits, etc., and full-time jobs number 118 million:


The Good And The Not- So-Good News About US Jobs In One Chart (Zero Hedge)


That's a ratio of roughly two workers for every retiree and considerably less than that for workers to the total number of government dependents. As the Baby Boom retires en masse, if full-time jobs don't rise as dramatically as the number of retirees, the system fails.


The happy story repeats the usual falsehood that Social Security has a Trust Fund it can draw down. This is a falsehood because the Trust Fund is fiction: when Social Security runs a deficit, the Treasury funds it by selling Treasury bonds, the same way it funds any other deficit spending. If the Treasury can't sell bonds, the phantom nature of the Trust Fund will be revealed.


2. Everyone who looks at numbers rather than fictional claims knows the intractable problem is Medicare and Medicaid. In Sickcare, there are no real limits on cost, and so every attempt to impose cost discipline fails or triggers blowback. Read more

Sunday, June 15, 2014

Should You Be Shorting Gold?

Submitted by Sprout Money on 06/15/2014 10:16 -0400
The recent price drop of gold is making investors nervous, that much is clear. People are tired of the negative price action and want to head for cover.

Although it is an understandable response, it is mostly an emotional one that does not have a lot in common with rational thinking.

By going short you want to protect a position, which you do when your expectations with regards to return are going down; when the potential upside is declining. The goal is, in any case, to protect your profit as much as possible with a short position.

Hedging or going short is NOT something you do after a large correction!

Nevertheless, the questions do arrive in our mailbox. People are asking us how they can short gold exactly at the time when it is pricing near a multi-year low.

Even more, gold is listed at half price in comparison to the period when the Fed’s balance sheet was less than half of the size it is now...

In other words, shorting gold today is not a very smart move…
Not only because the downside risk is decreasing every day, but because the upside potential is increasing every day. That is a deadly starting point for a short position.

Because shorting carries risks as well. In the first place, the possible (temporary) return is limited to 100%. For gold this is also practically impossible, because the price of gold will never be zero.

The potential loss you can make on a short position, in contrast, is unlimited. There is no limit to how high the price of a commodity can go. Secondly, you can only short gold through derivatives. That means in many cases that there is leverage involved.

The benefit of that is that returns would grow faster, but the disadvantage is that the losses will too. If you are not an expert in timing the purchase and sale of a short position then, you are most likely going to be in trouble. Even the pro’s admit that.

Whether shorting gold is smart? We do not think so. It could even do some serious damage to your portfolio.

Ultimately we understand that the price drop is a painful experience for gold investors, especially those who keep a close eye on the daily gold price.

Our advice: if you are sensitive to volatility, do not check the price daily.

Gold should be a long term investment / insurance within your portfolio, not a trade you enter for a few weeks or months to make a quick buck.

That is not the way you think about your house, for example, unless you call your real estate broker every week for a new valuation… Probably not.

Treat gold the same way. Do not look at the gold price daily, but consider gold to be part of your capital; an anchor of your wealth. It will save you from many sleepless nights.

Then there is the point of protection against a lower gold price, which is absurd in itself as well. If real estate drops 30% in value, people are lining up to buy. In gold’s case, however, everyone runs off. Strange, isn't it?!

We cannot emphasize it more: the only way to protect yourself from a lower gold price is by taking advantage of it.

If you know that the price of gold can never go down to zero, you should be ecstatic when the precious metal is for sale at wholesale prices. The only thing you need to make sure then, is that you have enough ‘paper money’ to exchange for gold.

Trust us, investing in gold requires a different mindset. The same kind you have when buying real estate, land, or art.

And if you then are really interested to take advantage of gold’s low valuation, know that we are focused on investing in the Best Selection of Gold Mining Stocks. That is where the true value is hidden in the gold market.

Do not be swayed by volatility or the negative headlines in the media. Gold and gold mining stocks have always been the right choice. In a few years, in a new monetary era, your buying power will be heard!

Sprout Money offers a fresh look at investing. We analyze long lasting cycles, coupled with a collection of strategic investments and concrete tips for different types of assets. The methods and strategies from Sprout Money are transformed into the Gold & Silver Report and the Technology Report.

Follow us on Twitter @SproutMoney
Source ZH

Friday, June 6, 2014

Equity Benefits From Central Bank Paper Shuffling: The Economy Not So Much

By Staff Report - June 06, 2014

Record rise for stocks before employment report ... U.S. stocks closed at record highs on Thursday, with both the Dow and the S&P 500 advancing further into uncharted territory, after the European Central Bank moved to combat disinflation and investors looked to Friday's employment report. "With the service sector quite strong, I think the jobs will surprise," said Peter Cardillo, chief market economist at Rockwell Global Capital. "The jobs market, unless it's overly strong or extremely weak probably could be less of an event as opposed to today's ECB meeting." – CNBC

Dominant Social Theme: The economy bounces back ... Stocks go up. And Wall Street parties on.
Free-Market Analysis: Read the above explanation for why stocks have "made a new record," and one can come away with the idea that the market is being driven by fundamentals like "employment" ... along with necessary strategies involving deeply discounted interest rates.

The overwhelming implication is that the market is responding to rational forces as wielded by the good, gray men of central banking. But what's going on, as usual, is a huge price-fixing scheme. Central bankers try anything and everything to ignite economies using equity prices as the fuel and fodder.

It's a crazy system that mostly benefits those who have the wherewithal to stay "invested" in the markets, and that usually means professional investors and the very wealthy. Only after markets have appreciated and ignited do the small fry begin to plunk their money down, and by then it is too late.

It is not too late now, in our view, but eventually it shall be. Markets continue to reach ever more dramatic valuations. The cycle would, in fact, be on the verge of turning if not for the determination of various controlling authorities to drive stocks higher, much higher, as we have often pointed out.

Here's more:
"This was a historic move by a major central bank," Mark Luschini, chief investment strategist at Janney Montgomery Scott, said of the ECB's decision to cut its key lending rate to 0.15 percent from 0.25 percent and the overnight deposit rate to 0.1 percent from zero, as policy makers attempt to fend off deflation in the region.

The added measures that have the ECB offering banks cheap, long-term funding so long as they use it to hike lending to companies were intended to provide "liquidity into the corporate marketplace, where banks have been reluctant lenders," said Luschini.

"Now we're looking at tomorrow's unemployment report. The news cycle only lasts five minutes. The market is anticipating, and I think correctly so, that the jobs number should be good, or somewhere around 200,000 in new jobs," said Paul Nolte, a senior vice president and portfolio manager at Kingsview Asset Management.

"Certainly based on the weekly jobless claims number, the jobs picture looks good," said Nolte of Thursday data that showed fewer Americans filed for unemployment benefits during the past month than at any time in seven years.

It is good to know that fewer filed for unemployment, but contrary to official statements, the US economy continues to be lousy. 

Unemployment is likely over 20 percent and large financial and industrial operations have been continually, artificially propped up by central bank money flows.

The result: It is difficult to know what companies are solvent and which are not. And this also damps business activity. No one wants to create a partnership with a potential bankrupt.

The ECB has the idea that it can counteract these trends by encouraging lenders, and also by making it more uncomfortable for them not to lend. Here, from the BBC:

ECB imposes negative interest rate ... The European Central Bank has introduced a raft of measures aimed at stimulating the eurozone economy, including negative interest rates and cheap long-term loans to banks. It cut its deposit rate for banks from zero to –0.1%, to encourage banks to lend to businesses rather than hold on to money. The ECB also cut its benchmark interest rate to 0.15% from 0.25%. The ECB is the first major central bank to introduce negative interest rates.

Howard Archer, chief UK and European economist at IHS Global Insight said: "Despite being widely anticipated and in some quarters criticised for occurring too late, it is still a bold and unusual move by the ECB to take its deposit rate into negative territory."

"There has to be considerable uncertainty as to how effective negative deposit rates will turn out to be," he added.

The negative interest rate – charging commercial banks to park their surplus funds – is perhaps the most striking element in this package. Negative rates do happen now and then, but they are rare and often a sign of some sort of financial or economic stress.

That certainly applies in this case, where the eurozone economic recovery is weak and risks being undermined by deflation or falling prices. One source of weakness is declining bank loans to the private sector. The negative rate might encourage banks to lend more, but it also imposes a cost on them and so might affect their profitability.

... Mr Draghi said that the whole package of measures was aimed at increasing lending to the "real economy". "Now we are in a completely different world," he said. Even though some of the measures, like the more to negative rates on deposits, were expected European shares moved higher on the ECB announcement.

Mr. Draghi is living in a fantasy world if he believes he is lending to the "real economy." In fact, given the level of regulation and monetary stimulation, markets are elevated far above where they would be if markets were left alone to create valid valuations.

The Wall Street Party continues, as we can see, unmoored from what is actually taking place in larger Western economies. That's because governments and those who stand behind governments are committed to creating a new equity bubble for reasons we have explained many times.

First comes the ascension, and then the downturn. The farther up the marts go, the farther they will fall. If the disaster is powerful enough, the globalists will begin to offer the alternative of an even larger and more centralized system under the self-serving justification that only an even larger structure can create longed-for stability.

This leads to all sorts of peremptory shifts in strategy, abrupt changes in direction as top bankers seek the best way to ignite markets. 

Rational policies are abandoned and yesterday's rhetoric is simply replaced by different justifications. The controlled mainstream media seems to have little or no ability to reference previous reporting.

Draghi, for instance, has been talking about the "European recovery" for several years. Yet now he takes seemingly desperate measures to try to get money circulating again. He is pushing on a proverbial string.

Conclusion
Equity benefits from all this paper shuffling and not much else. But perhaps that's the point.
via Dailybell