October 10, 2011
Anyone who follows financial markets is well aware that the past few months have been brutal for investors. Commodities in particular were hit extremely hard during the latter half of September, falling to multimonth lows in many cases. Concern that the ongoing sovereign debt crisis in Europe and economic weakness in the United States would spread to the rest of the world was the catalyst for the downward move.Even the safe-haven vehicles gold and silver tumbled in September. Investors often flock to the pair during times of uncertainty, but as we’ve consistently seen, when financial conditions get particularly rough, gold and silver lose their safe-haven appeal.
Yet as we wrote in our last two editions of Precious Metals Monitor, prices may have already struck bottom. And though we don’t expect them to run away to the upside, now may be the time for long-term investors to accumulate positions.
That said, what should an investor buy: gold or silver? That is always an interesting question, but especially so during periods of rapid price movements such as now. Both metals hit record highs earlier this year, at $1921.15/oz and $49.79, respectively.
Though the timing of the highs was a bit different — silver peaked in April, while gold peaked in early September — investors bought the two for similar reasons; that is, to hedge against inflation and sovereign debt fears.
Conversely, when prices were falling, silver got hit harder for another reason: It has a much more significant industrial-demand component that gold. Close to 46 percent of silver’s total demand comes from industrial users. That figure is only 11 percent for gold.
Thus, when economic concerns are prevalent as they have been recently, it’s no surprise that silver would fall more. On the other hand, when economic conditions improve, silver typically outperforms. This has been the paradigm over the past 20 years.
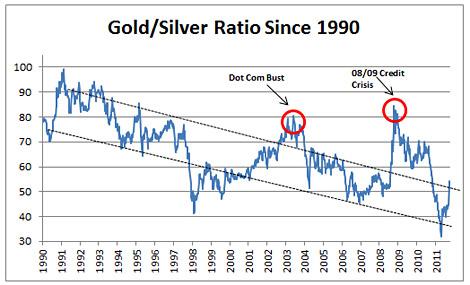
The best way to see this is through the gold/silver ratio, which measures the relative value of the two precious metals. The higher the gold/silver ratio, the more expensive gold is relative to silver. Conversely, the lower the ratio, the more expensive silver is relative to gold.
Since 1950, the ratio has been quite volatile. From 1950 to 1980, it fluctuated mostly between 20 and 50.

From 1980 to 1990, the ratio surged to 100 as the sector plunged from their record highs amid a taming of inflation and central bank selling of gold. The period from 1990 to 2000 saw a normalization in the ratio as silver prices ticked up a bit. Finally, 2000 to 2011 is the latest period in which the ratio has trended significantly lower, as both gold and silver prices have rallied sharply.
Below is the gold/silver ratio since 1990, when the ratio peaked close to 100.

The trend has been gradual, but consistently lower. The only instance when the ratio deviated significantly from the overall downtrend was in 2008/2009, during the depths of the financial crisis in those years. Another peak corresponded with the dot-com bust during the early part of the last decade...read more>>