Gold Bottom Targets Trend To $4,000
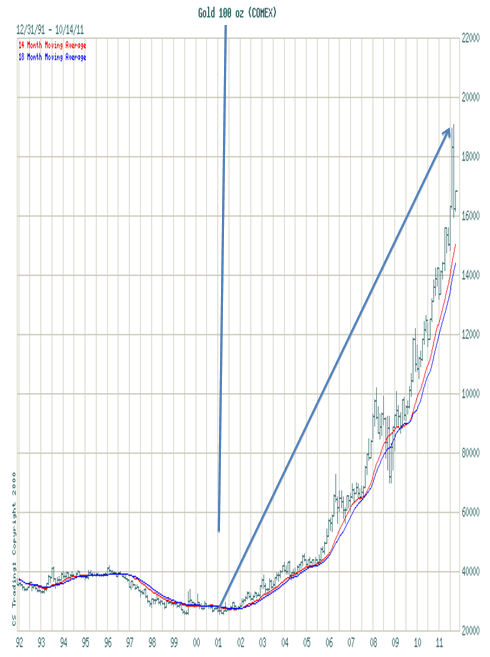
I want to discuss what gold has done, where it's at now, and then end with where it's going from here and postulate why it's going to do what it will do. Right now you need to understand that gold is beginning the twelfth year of major bull market; perhaps the most unprecedented bull market in our lifetime. Here's a quick snapshot of what that bull market has looked like since the 1999 bottom and the 2001 retest of that bottom:

2000 -- $273.60
2001 -- $279.00
2002 -- $348.20
2003 -- $416.10
2004 -- $438.40
2005 -- $518.90
2006 -- $638.00
2007 -- $838.00
2008 -- $889.00
2009 -- $1096.50
2010 -- $1421.40
2011 -- $1566.80
I know of no other market that can make this claim although I will admit that I don't follow certain markets like milk, wine and ferrets.
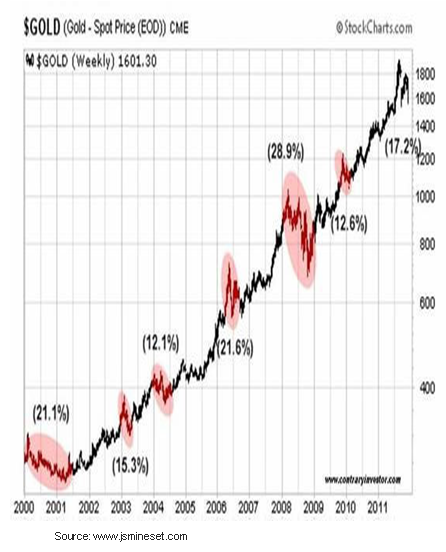
Now I want to look at the same time period but from a different perspective, this time in terms of corrections, because every primary bull market of any duration experiences secondary corrections. Every significant move in price has reactions and there is no way around it; you just have to be smart enough to recognize it for what it is, a reaction, and sit tight. So here it is:

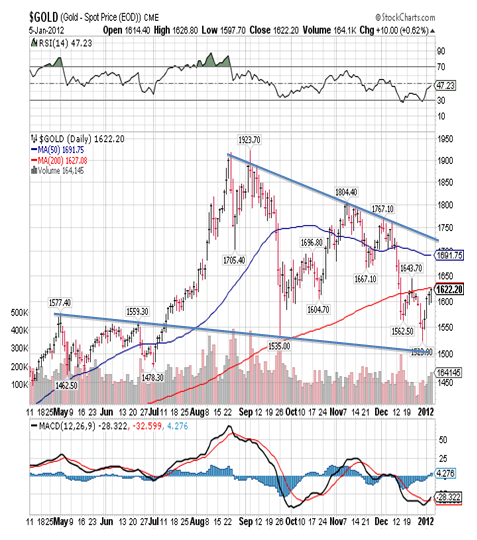
I have drawn a very simple nine-month daily chart of gold and I've put in the only two lines that matter. The top line is downward sloping and represents resistance while the bottom line is also downward sloping and represents support:

One of the reasons I believe we've seen the bottom has to do with the 90-day cycle, one of the most dominant cycle's in the markets over the last decade. Gold topped with an all-time closing high of 1,900.60 on August 22nd and then declined to a closing low of 1,548.70 exactly ninety days later. That in my opinion is not a coincidence.
Since then gold has rallied to yesterday's 1,622.20 close, and that was the second consecutive close above what was good resistance at 1,605.50. What's more the back-to-back double-digit rallies on Wednesday and Thursday were in spite of strong rallies in the US dollar and general weakness in stocks. Three weeks ago such conditions would have driven the price of gold down twenty or thirty dollars, so it appears we have a change in character. As I've mentioned before a change in character often precedes or accompanies a change in direction.
Perhaps the most important development in the world of gold has to do with the fact that China, one of the world's largest importers of gold, is no longer content to buy their precious metal for the floor of the COMEX or London metals exchange. Why? There are two principal reasons:
- The COMEX has more than US $86 billion in contracts (obligations) floating around at any one time. Yet in storage they have slightly less than US $3 billion. So the COMEX is not only woefully short of supply should there be a run, they are allowing large traders to flood the market with paper gold in an effort to suppress the price. If you're China and you're building your inventory, that's not in your best interest.
- There are questions regarding the purity of the metal sold by the COMEX and London metals exchanges.