Posted on 26 September 2012
 Whatever the worries about slowing global industrial output now
for the price of silver, the signal from the technical charts is
completely unambiguous. There is a classic golden cross with the 50-day
moving average crossing over the 200-day moving average. That means buy.
Whatever the worries about slowing global industrial output now
for the price of silver, the signal from the technical charts is
completely unambiguous. There is a classic golden cross with the 50-day
moving average crossing over the 200-day moving average. That means buy.
Basically this is an upward price momentum indicator. Traders see this as a classic buying signal, and so it tends to be somewhat self-fulfilling. As the silver price chart below from Goldsilver.com shows, the last three times this has happened it has been followed by an explosive price movement:
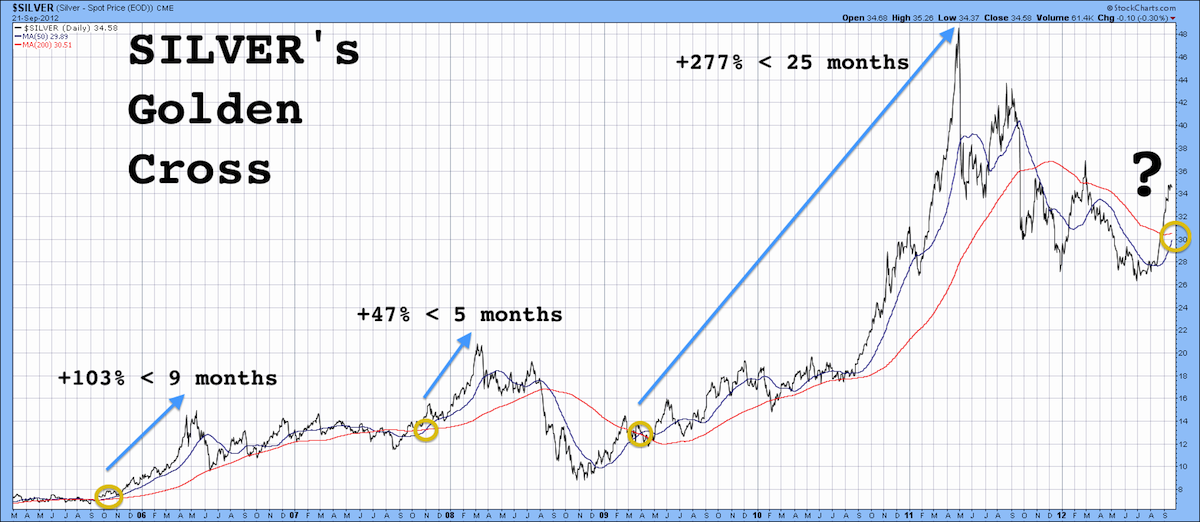
Do the maths and extrapolate the previous price movements from the golden crosses: a 47 per cent move in five months takes us to $51 an ounce by next February; a 103 per cent price hike in nine months takes us to $70 by next June; and 277 per cent over 25 months has silver at $130 an ounce in October 2015.
Caveat emptor
Of course we can still see short-term price pull backs within any of these timeframes. Silver is notoriously volatile and would most likely be badly struck by a sharp fall in global financial markets say next month. In 2008 it crashed by almost 60 per cent to $8 an ounce but quickly rebounded along with gold.
The bravest and boldest trade might therefore be to stock up on silver in the bleakest moment of any downturn. It’s an investment strategy we will be looking at in more detail in our newsletter next month.
Golden cross in the silver technical chart signals a big price advance imminent
Whatever the worries about slowing global industrial output now
for the price of silver, the signal from the technical charts is
completely unambiguous. There is a classic golden cross with the 50-day
moving average crossing over the 200-day moving average. That means buy.Basically this is an upward price momentum indicator. Traders see this as a classic buying signal, and so it tends to be somewhat self-fulfilling. As the silver price chart below from Goldsilver.com shows, the last three times this has happened it has been followed by an explosive price movement:
Do the maths and extrapolate the previous price movements from the golden crosses: a 47 per cent move in five months takes us to $51 an ounce by next February; a 103 per cent price hike in nine months takes us to $70 by next June; and 277 per cent over 25 months has silver at $130 an ounce in October 2015.
Caveat emptor
Of course we can still see short-term price pull backs within any of these timeframes. Silver is notoriously volatile and would most likely be badly struck by a sharp fall in global financial markets say next month. In 2008 it crashed by almost 60 per cent to $8 an ounce but quickly rebounded along with gold.
The bravest and boldest trade might therefore be to stock up on silver in the bleakest moment of any downturn. It’s an investment strategy we will be looking at in more detail in our newsletter next month.
Golden cross in the silver technical chart signals a big price advance imminent