Submitted by GoldCore on 08/13/2013 10:10 -0400
Gold climbed $23.30 or 1.77% yesterday and closed at $1,335.90/oz. Silver surged $0.88 or 4.3% and closed at $21.34.
Gold is marginally lower in all currencies today after yesterday's gains as markets await U.S. economic data releases.
Indians purchased more gold in July than June in spite of the governments efforts to curb supplies and increase tariffs. Yet the Indian government, is doubling down in their desperate, some would say futile, attempts to curb the people of India’s preference to save in gold.
India raised the tax on imports for a third time this year this morning. The duties on gold and platinum imports were increased to 10 percent from 8 percent, while the levy on silver was boosted to 10% from 6%.
Physical demand in the east is still strong ahead of the festival and wedding seasons which see increased demand.

Silver has consolidated on it’s sharp 4.3% rise yesterday and has risen another 1.2% in European trading this morning.
Silver climbed for a fifth day yesterday and has now surged 12% in 5 trading days. It has risen from a low of $19.17/oz last Wednesday to $21.66/oz in recent trading.
Silver futures have declined 28.6% this year in New York, the biggest loss among the 24 commodities tracked by the Standard & Poor’s GSCI Spot Index but the smart money is continuing to accumulate on the dip.
Recent resistance at $20/oz and $20.50/oz has been overcome and silver is set to test resistance at $22/oz. Above $22/oz, the next level of resistance is at $24/oz and $25/oz.
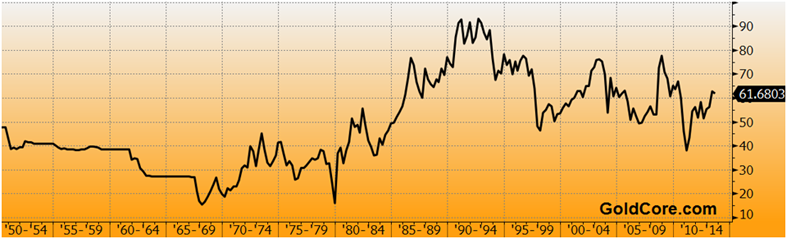
An ounce of gold bought 61.5 ounces of silver in London today and the gold silver ratio has fallen from over 67 at the start of August.
Since 2003, we have said that the gold silver ratio would in time revert to its long term, historical average below 20 to 1 (see charts below). In a note today, UBS say that the gold silver ratio should drop toward 50 in the next couple of years as silver continues to outperform gold.

The death of the silver bull market is greatly exaggerated as seen in the still very robust physical demand from investors and store of value buyers internationally.
This can be seen clearly in American Silver Eagle sales and in the silver ETF holdings.
Sales of silver coins by the U.S. Mint have set a record high in the first half of 2013 seeing the best start to a year ever.
Year to date Silver Eagle sales are at 30.3 million, a record pace that was supported by soaring July sales. Silver Eagle sales had a record year in 2011. That year, it took until September 21, 2011, to reach above 30 million in sales for the year.
Therefore, 2013 looks set to be a record year for Silver Eagle sales.
Silver coin sales were suspended in January for more than a week because of a lack of silver inventory. In April, purchases more than doubled from a year earlier after prices tumbled 16% in two days due to unusually aggressive selling of paper silver on the futures market.
Silver ETF holdings which have continued to increase in recent weeks and months even as the gold ETF holdings saw falls.
Silver holdings in the IShares Silver Trust, the biggest exchange-traded fund backed by silver, were unchanged at 10,396.73 metric tons as of Aug. 12 but remain near record levels.
Falling prices and concerns about being able to take delivery of coins amid continuing concerns about the U.S. economy and currency debasement have led to the record demand.
Bull markets do not end in a period of sustained physical demand nearly two years after prices have “peaked”.
This strongly suggests that silver’s bull market is far from over. Silver has gone from being massively undervalued in the early 2000’s to being fairly valued today.

Bull markets end in speculative manias with mass participation by the public and blow off tops where prices become massively overvalued as seen in 1980.
In 1980, silver rose from $6.08/oz on January 2nd 1979, to $50/oz on January 21st 1980, or more than eight fold in less than 13 months.
This has not happened with silver yet. Most of the public does not even know the price of an ounce of silver, let alone its value and how to own it. Silver remains gold’s very poor cousin and gets little or no media attention.
The parabolic spike led to the gold silver ratio collapsing to 17 to 1 ($850 oz / $50 oz). We expect a similar outperformance and parabolic final price move in silver.
Bull markets see prices rise to above their inflation adjusted highs. Sometimes prices rise to multiples of their previous inflation adjusted high.
Silver’s inflation adjusted high was $130/oz and we continue to see that as a realistic long term price target.
Given silver’s volatility, dollar, pound or euro cost averaging into position remains prudent.
It is also important to note that when prices have had a parabolic gain - dollar, pound or euro cost averaging out of a position will be prudent as it will be nigh impossible to time the top.
Source: ZH